Fitxategi:Sinh cosh tanh.svg
Nabigaziora joan
Bilaketara joan

SVG fitxategi honen PNG aurreikuspenaren tamaina: 504 × 504 pixel. Bestelako bereizmenak: 240 × 240 pixel | 480 × 480 pixel | 768 × 768 pixel | 1.024 × 1.024 pixel | 2.048 × 2.048 pixel.
Jatorrizko fitxategia (SVG fitxategia, nominaldi 504 × 504 pixel, fitxategiaren tamaina: 17 KB)
Laburpena
| Deskribapena |
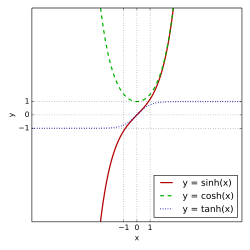
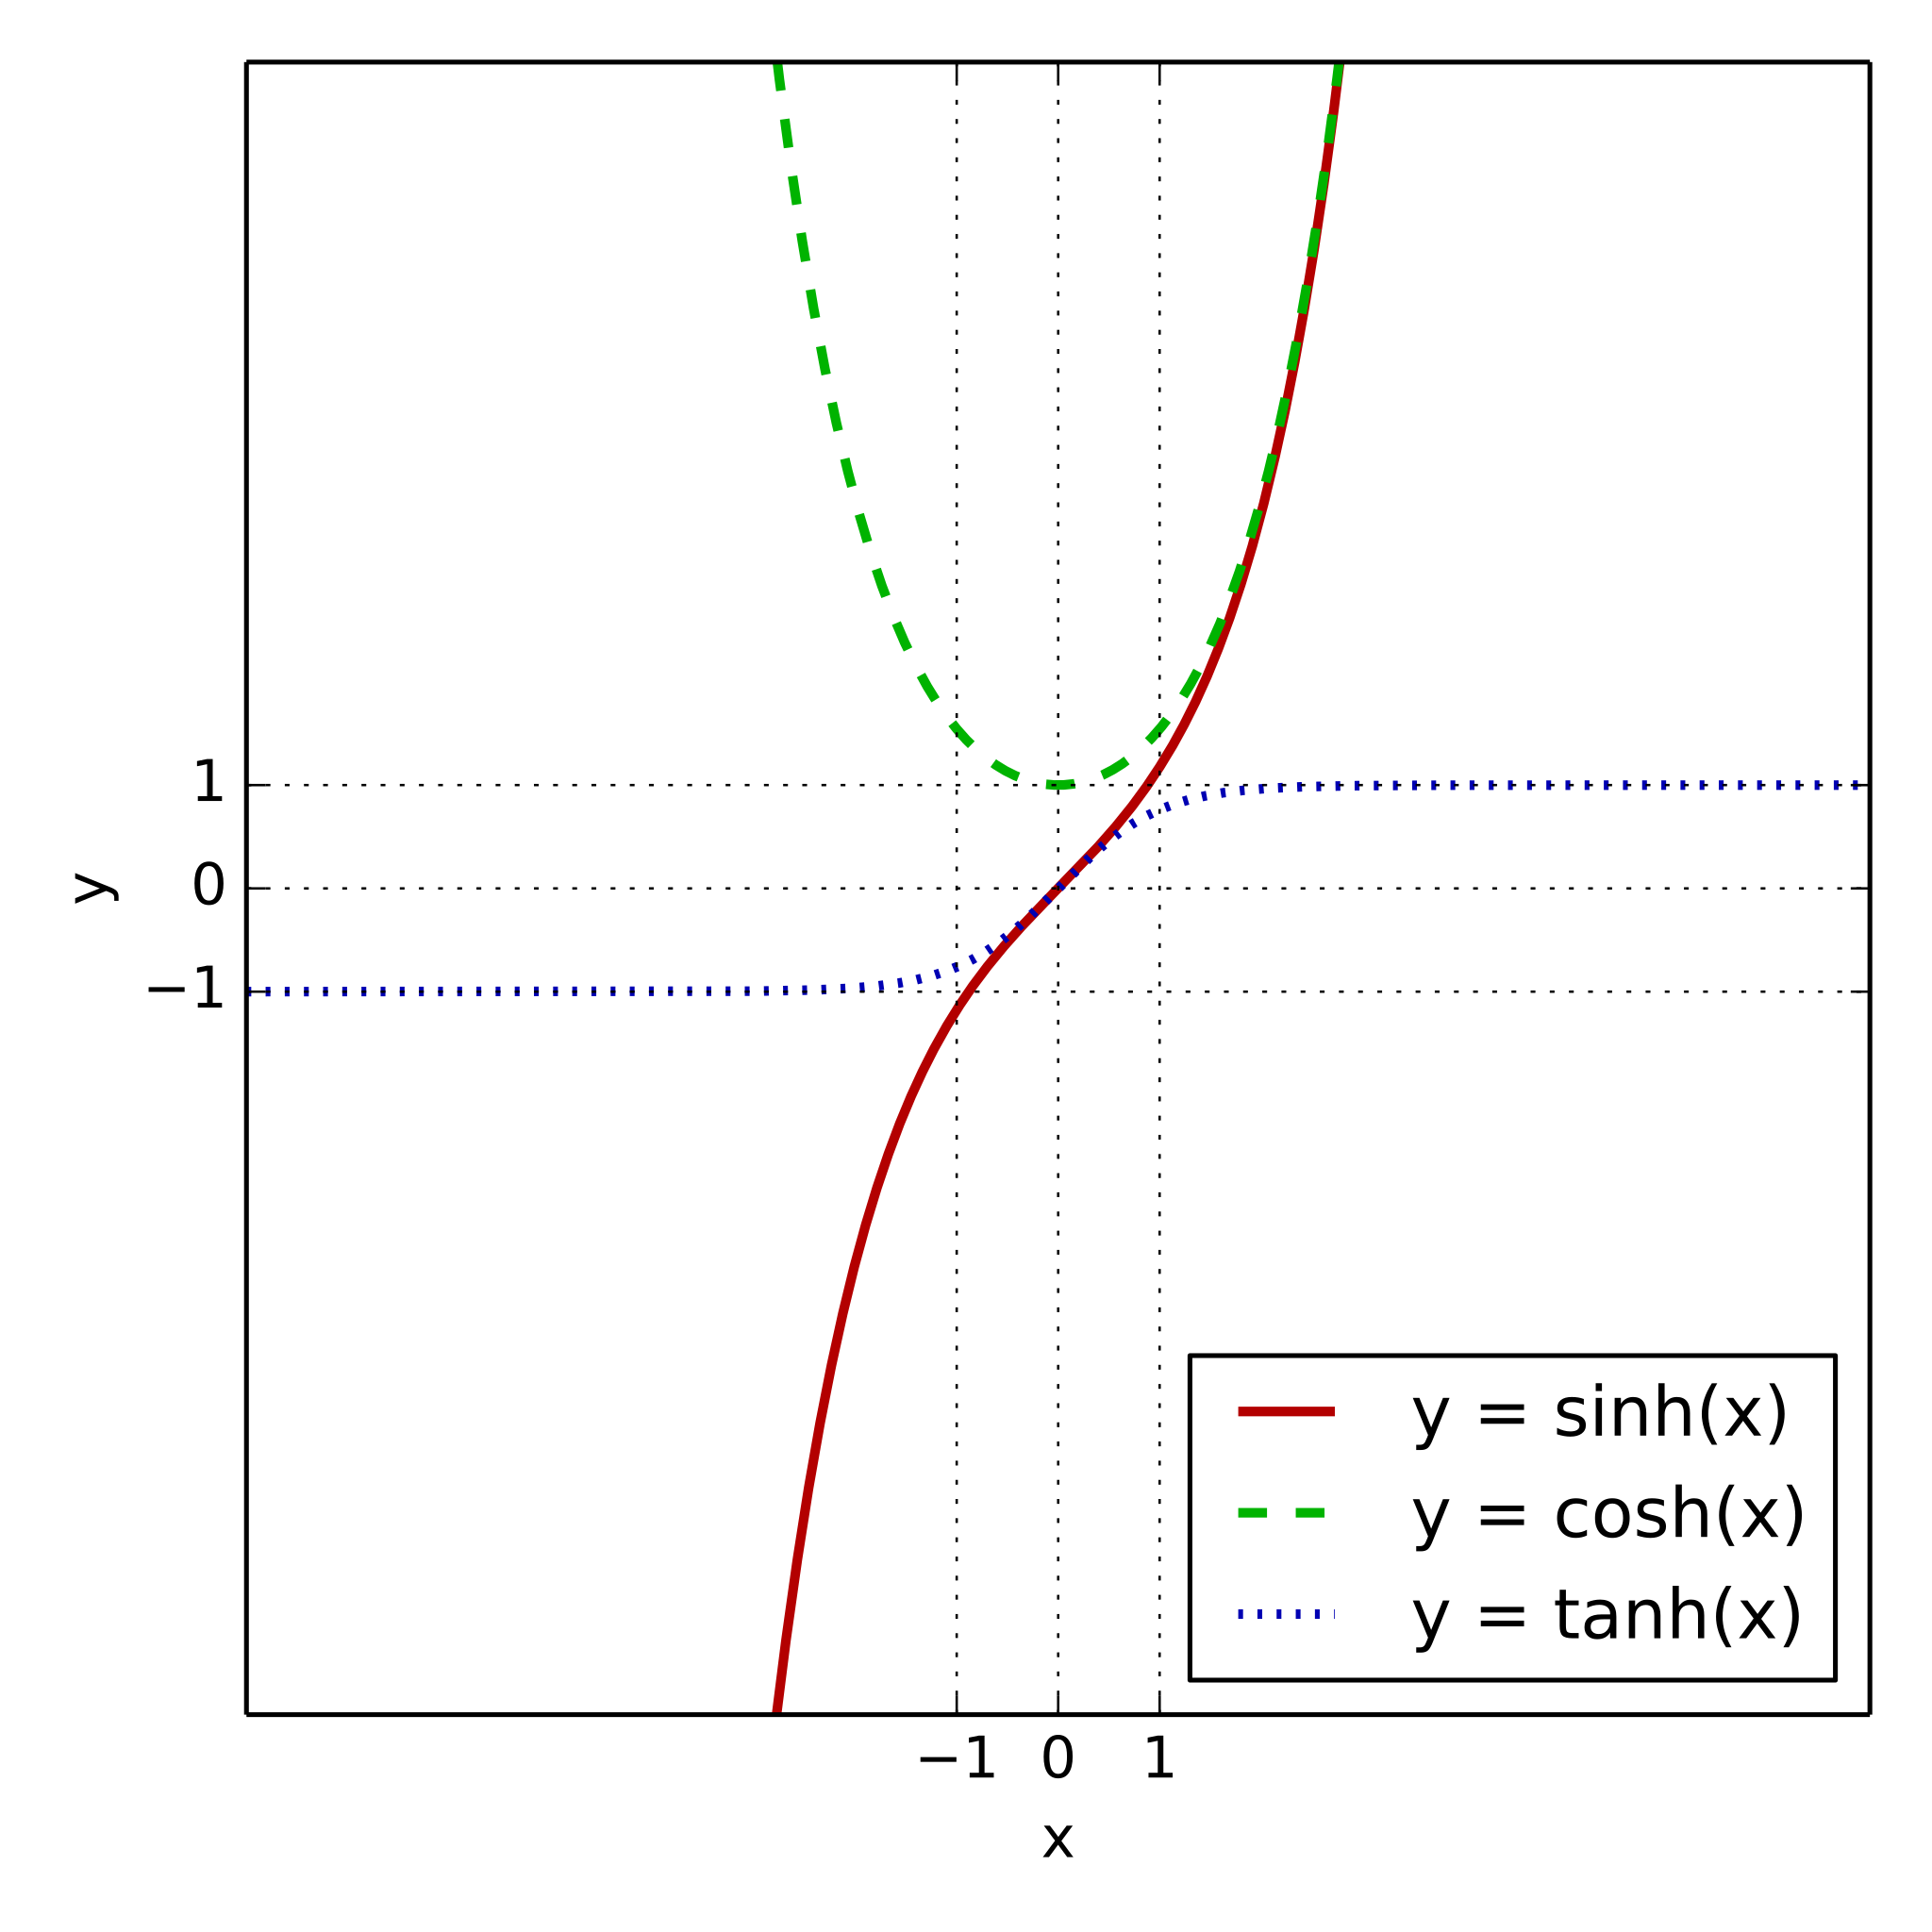
The hyperbolic sine (red), hyperbolic cosine (green) and hyperbolic tangent (blue) graphed on the same axes. Replaces en:Image:sinh cosh tanh.png
|
| Data | |
| Jatorria | Norberak egina |
| Egilea | Fylwind at ingelesa Wikipedia |
| SVG genesis | |
| Iturburu kode | Python codeimport numpy as np
import matplotlib.pyplot as plt
lim = 8
size = 5.6
fig, ax = plt.subplots(figsize=(size, size))
xs = np.linspace(-lim, lim, 1000)
ax.plot(xs, np.sinh(xs), label="y = sinh(x)",
color="#b30000", linestyle="-", linewidth=2)
ax.plot(xs, np.cosh(xs), label="y = cosh(x)",
color="#00b300", linestyle="--", linewidth=2)
ax.plot(xs, np.tanh(xs), label="y = tanh(x)",
color="#0000b3", linestyle=":", linewidth=2)
ax.set_xlim(-lim, lim)
ax.set_ylim(-lim, lim)
ax.set_xticks([-1, 0, 1])
ax.set_yticks([-1, 0, 1])
ax.set_xlabel("x")
ax.set_ylabel("y")
ax.grid("on")
ax.legend(loc="lower right")
fig.tight_layout()
fig.savefig("sinh_cosh_tanh.svg", transparent=True)
|
Lizentzia
| Nik, lan honen egile eskubideen jabeak, lan hau domeinu publikoan jartzen dut. Mundu osoan du eragina honek. Estatu batzuetan beharbada hori ez da legez posible izango. Halakoetan: Edonori ematen diot lan hau edozertarako erabiltzeko eskubidea, inolako baldintzarik gabe, legeak nahitaez ezarritako baldintzak izan ezik. |
Jatorrizko igoera erregistroa
The original description page was here. All following user names refer to en.wikipedia.
- 2006-03-14 10:22 Ktims 1600×1200×0 (8934 bytes) The hyperbolic sine (red), hyperbolic cosine (green) and hyperbolic tangent (blue) graphed on the same axes.
- 2006-03-14 10:21 Ktims 1600×1200×0 (8965 bytes) The hyperbolic sine (red), hyperbolic cosine (green) and hyperbolic tangent (blue) graphed on the same axes.
- 2006-03-14 10:15 Ktims 1600×1200×0 (8967 bytes) The hyperbolic sine (red), hyperbolic cosine (green) and hyperbolic tangent (blue) graphed on the same axes.
- 2006-03-14 10:15 Ktims 1600×1200×0 (8980 bytes) The hyperbolic sine (red), hyperbolic cosine (green) and hyperbolic tangent (blue) graphed on the same axes.
- 2006-03-14 10:14 Ktims 1600×1200×0 (8902 bytes) The hyperbolic sine (red), hyperbolic cosine (green) and hyperbolic tangent (blue) graphed on the same axes.
Fitxategiaren historia
Data/orduan klik egin fitxategiak orduan zuen itxura ikusteko.
| Data/Ordua | Iruditxoa | Neurriak | Erabiltzailea | Iruzkina | |
|---|---|---|---|---|---|
| oraingoa | 00:27, 11 martxoa 2016 | | 504 × 504 (17 KB) | wikimediacommons>Fylwind | Make asymptotics more evident. |
Fitxategiaren erabilera
Fitxategi hau darabil ondorengo orri honek: